
About Me
Clarity. Impact. Actionable Data.
I’m a Data Scientist and ML Specialist who helps businesses transform raw data into actionable solutions.As an experienced Data Scientist now working independently, I build end-to-end solutions that move beyond just code, I focus on delivering clarity, automation, and business outcomes.
From cleaning chaotic spreadsheets to building machine learning systems that forecast sales, segment customers, or flag business risks, my goal is to solve real problems, not just complete deliverables.Skilled in Python, SQL, Pandas, NumPy, Scikit-learn, NLP, Selenium + BeautifulSoup, Streamlit, Flask, Excel Automation (VBA + Python), APIs, Docker, HuggingFaceCurrently offering freelance services via Fiverr and open to collaborations, consulting, and short-term contracts where data needs to be turned into impact.Let’s build something clean, scalable, and actually useful.
Services I offer
Data Cleaning & EDA
- Clean, structured data
- Handling missing values and outliers
- Running statistical checks to uncover insights and key findings
Machine Learning Models
- Sales Forecasting, Churn Prediction, Customer Segmentation, Recommendation Engines
- End-to-end model building
- Deployed using Streamlit, Flask, Docker on cloud platforms like Render, Railway, HuggingFace, Streamlit Cloud
Web-Scraping for Business Data
- Extract clean, structured data from websites using Python (BeautifulSoup, Selenium, Requests)
- Build scrapers for listings, reviews, product details, pricing data, and more
- Deliver datasets in Excel/CSV format, ready for analysis, automation, or integration
Excel Automation
- Automate repetitive Excel tasks using Python (openpyxl, pandas) or VBA
- Generate dashboards, apply conditional formatting, and auto calculate KPIs
- Deliver reusable, documented Excel reports for smooth business operations
Skills

Python | MySQL | Machine Learning (AI) | Power BI | Data Cleaning & EDA | Dashboarding | Excel Automation | Data Visualization | Web Scraping | API Integration
Data Visualization & Reporting (Power BI | Matplotlib | Seaborn | Plotly)
Machine Learning & Model Building (Scikit-learn | XGBoost | Pandas | NumPy)
Deployment & App Development (Streamlit | Flask | Docker | REST APIs)
SQL & Database Management (MySQL | Joins | Subqueries | Window Functions)
Excel Automation & Scripting (Excel | VBA | OpenPyXL | Pandas | Python Automation)
Web Scraping & API Integration (BeautifulSoup | Requests | Selenium | JSON APIs)
Featured Work Samples
Python, Machine Learning & Streamlit
Built a content-based recommendation engine using NLP to help a client reduce decision fatigue and boost user engagement.
Deployed via Streamlit using TMDB & RAWG APIs.

Cinema and Game Recommendation Engine

Customer Segmentation and Profiling
Python, Machine Learning & Streamlit
Built a clustering-based segmentation model to group a retail brand’s customers by behavior, enabling more personalized marketing and improved engagement strategies.
Python, Machine Learning & Streamlit
Built an AI-powered system using XGBoost and KMeans to predict loan defaulters and guide recovery strategies. Deployed as a Streamlit dashboard with SHAP explainability and actionable visual insights.

AI-Powered Loan Risk & Recovery system
Professional Certifications
Recognized credentials validating my skills in data science, analytics, and real-world problem solving.

Data Analyst | Issued April 2024Data Scientist | Issued March 2025

SQL Basic | Issued September 2024
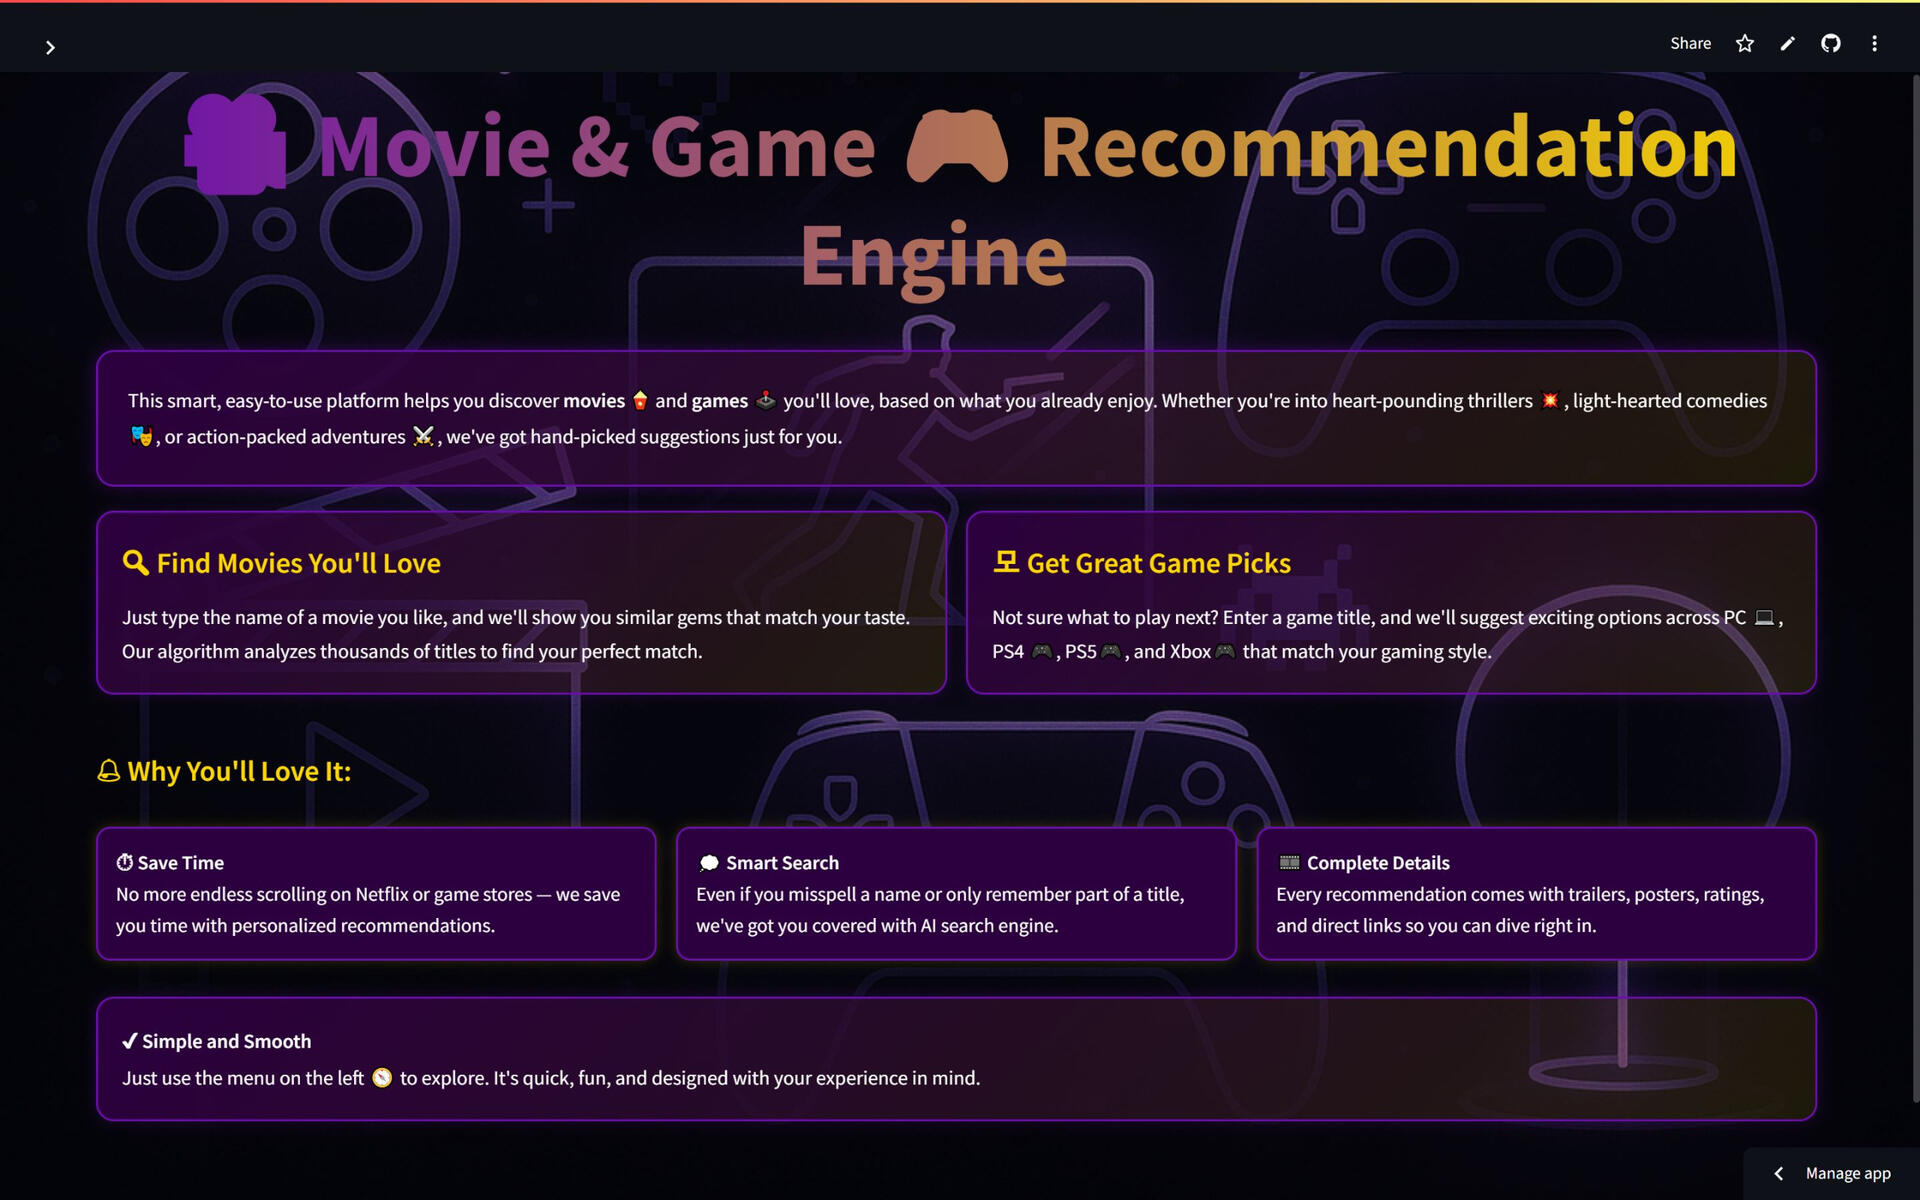
Cinema and Game Recommendation System
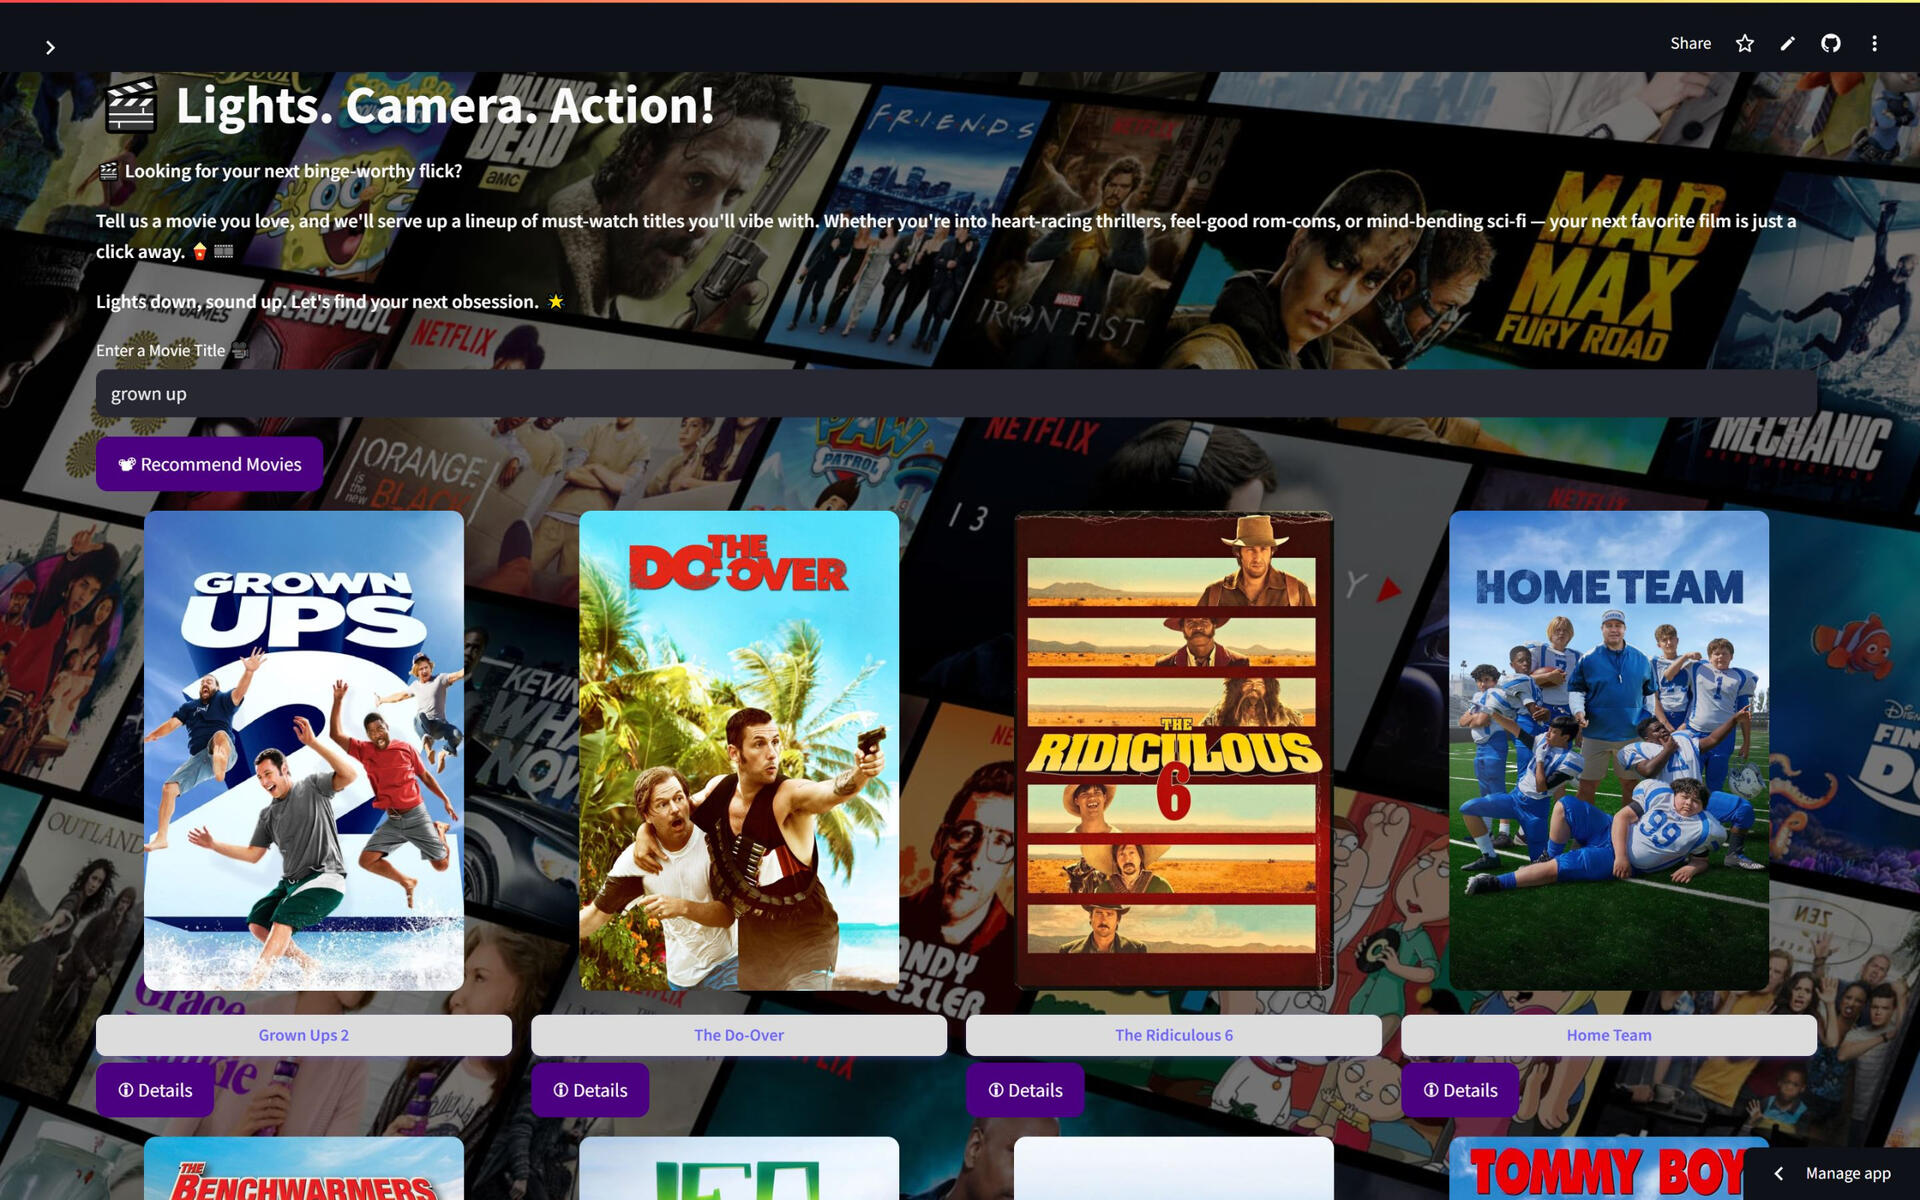
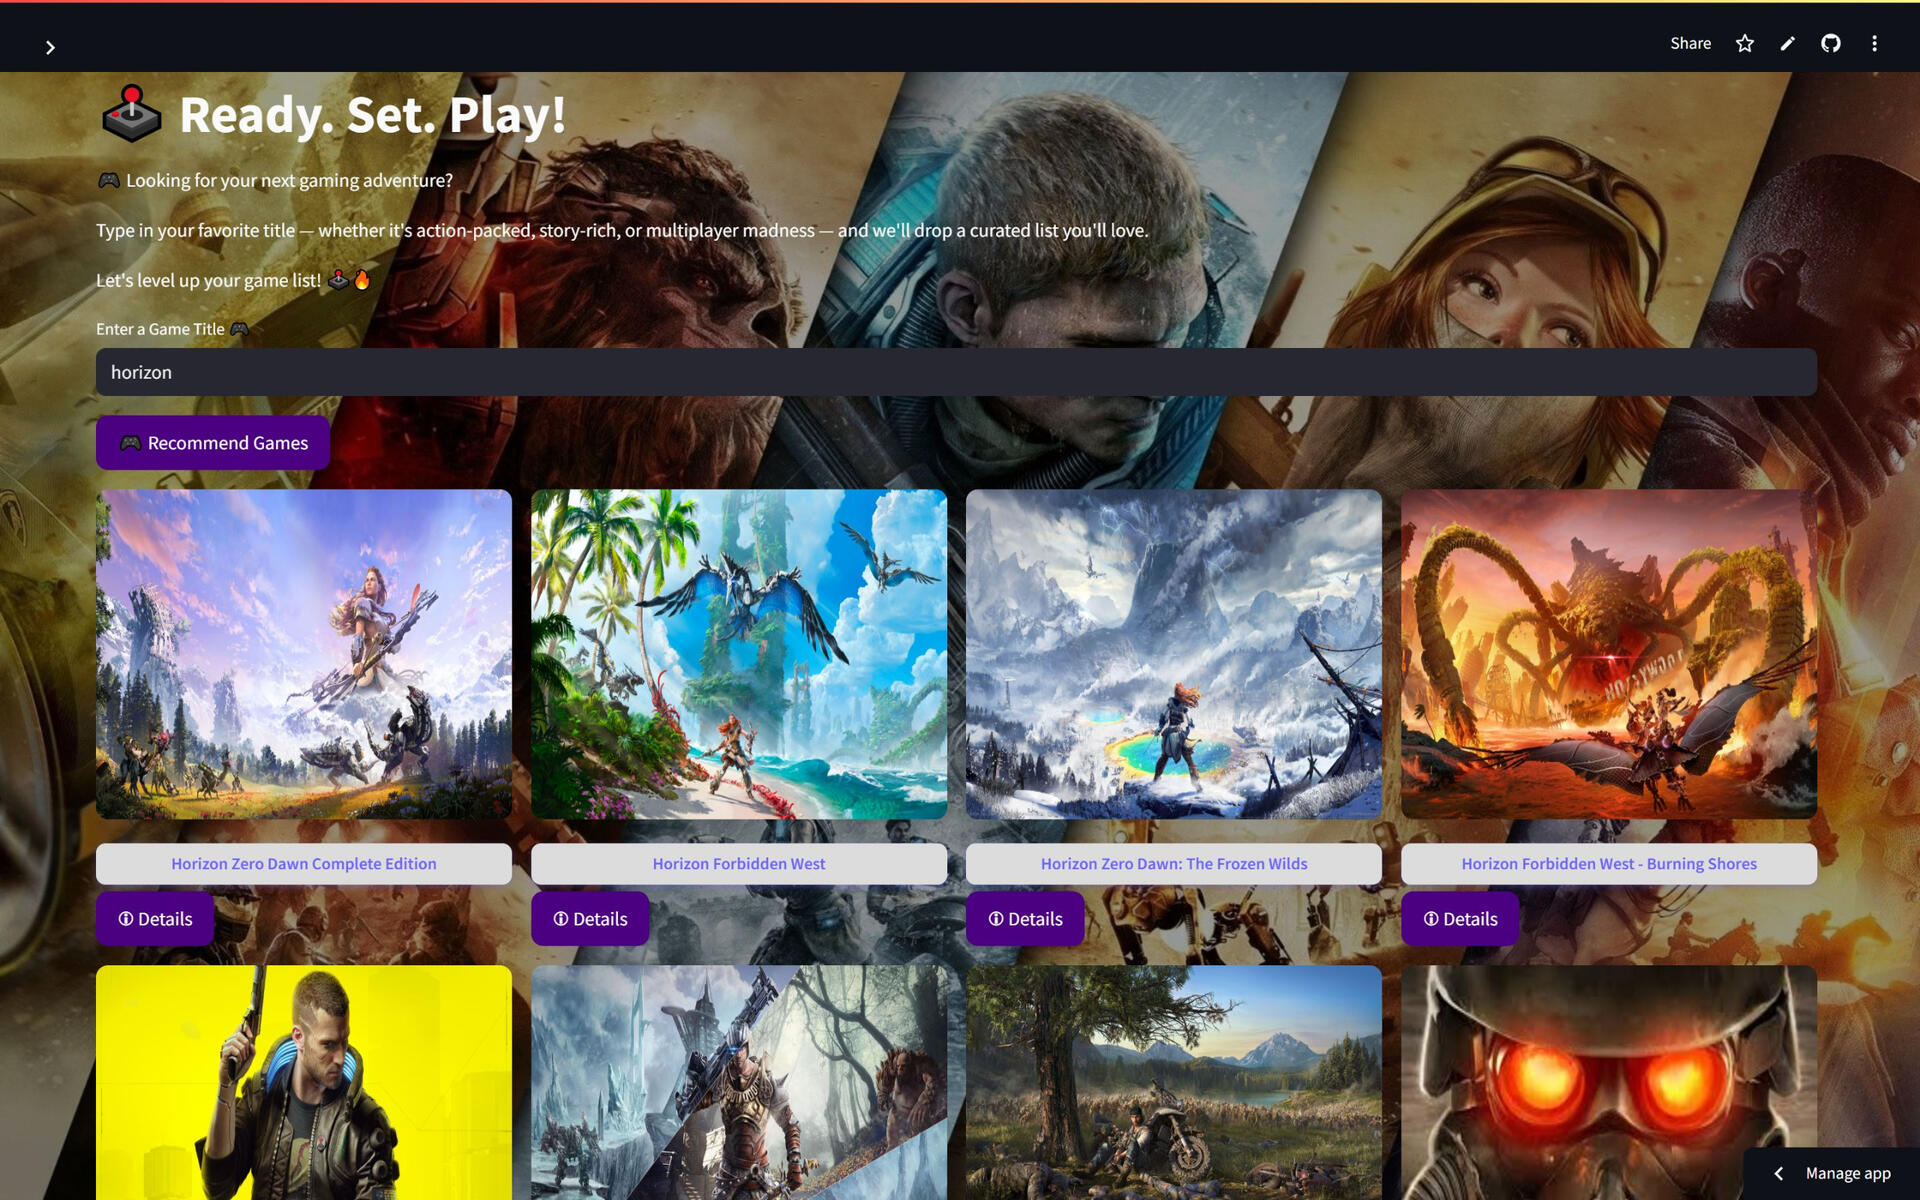
The Movies & Games Recommendation Engine is a content-based system built with Python and Streamlit. It uses NLP techniques like cosine similarity and fuzzy matching to recommend similar titles based on user input. Users get personalized movie/game suggestions with posters, ratings, and links, all in an interactive web app.
Client Goal:
Create a recommendation system that reduces choice fatigue and boosts user engagement for an entertainment-focused platform.
Problem:
Users often feel overwhelmed by too many options across OTT and gaming platforms, leading to lower engagement and decision drop-off.Solution:
Developed a content-based recommendation engine using NLP techniques like cosine similarity and fuzzy matching. Integrated with TMDB and RAWG APIs, the system delivers personalized movie/game suggestions with visuals, ratings, and clickable links, all wrapped in an interactive Streamlit app.
Impact:
Simplified content discovery, improved user satisfaction, and increased session duration through personalized experiences.Tech Stack:
Python, Pandas, Scikit-learn, FuzzyWuzzy, TMDB API, RAWG API, Streamlit
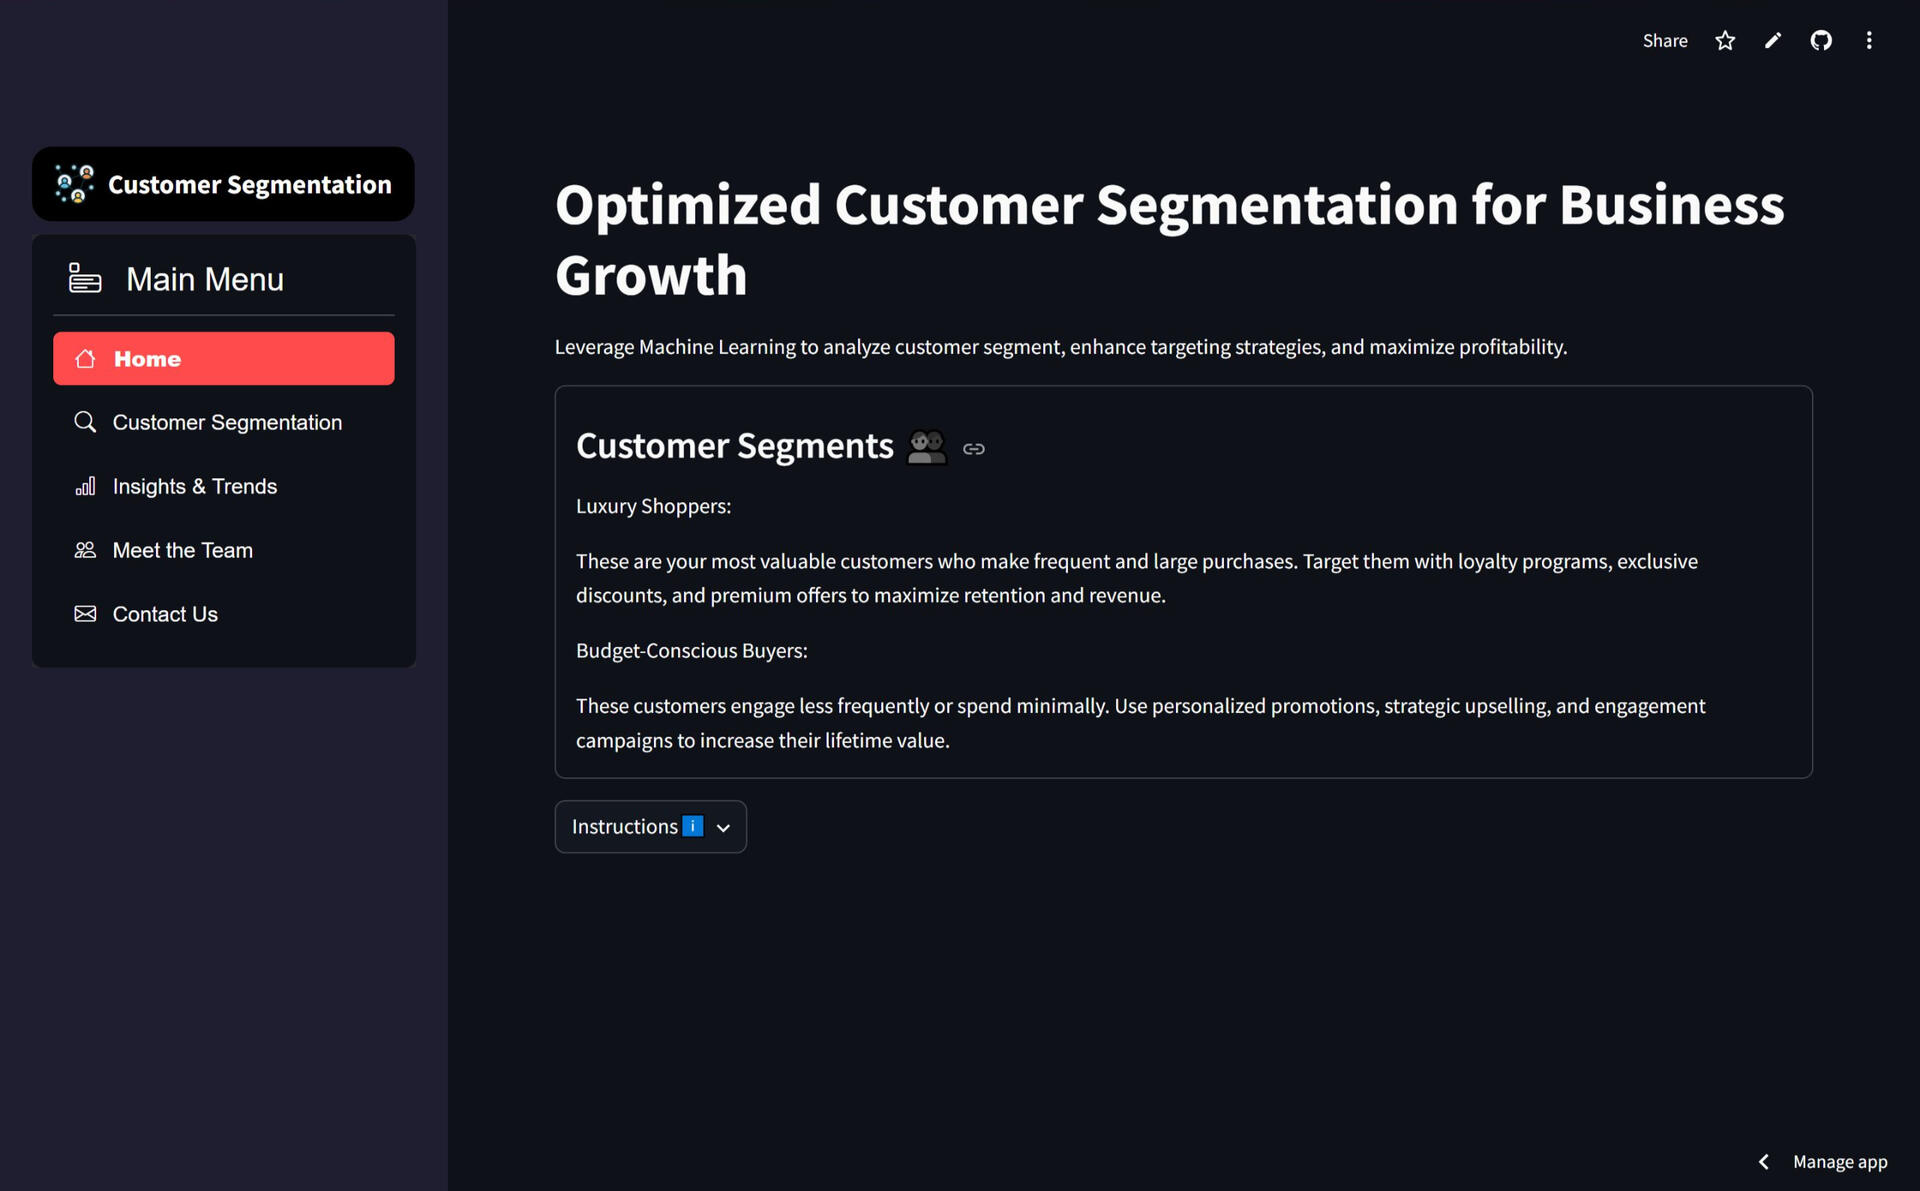
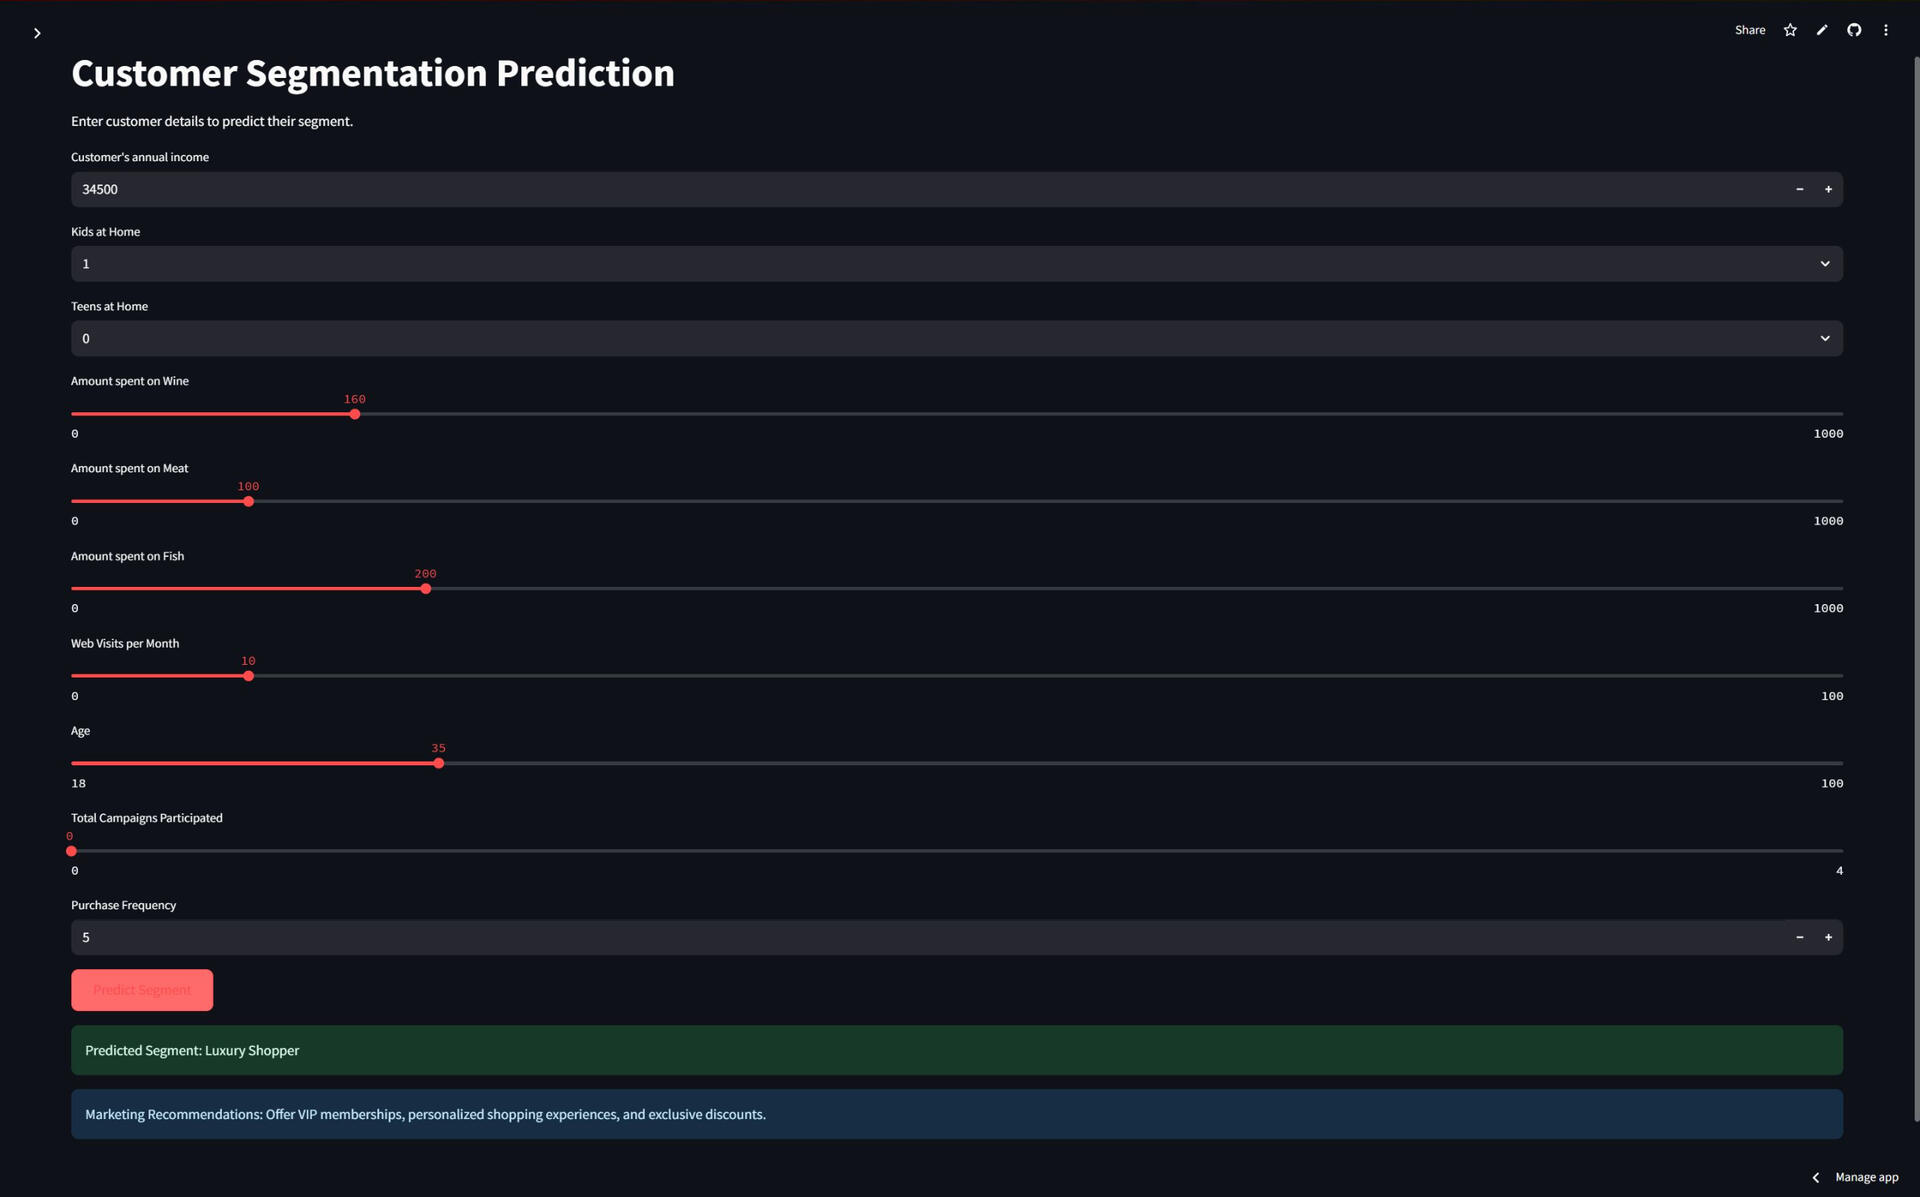
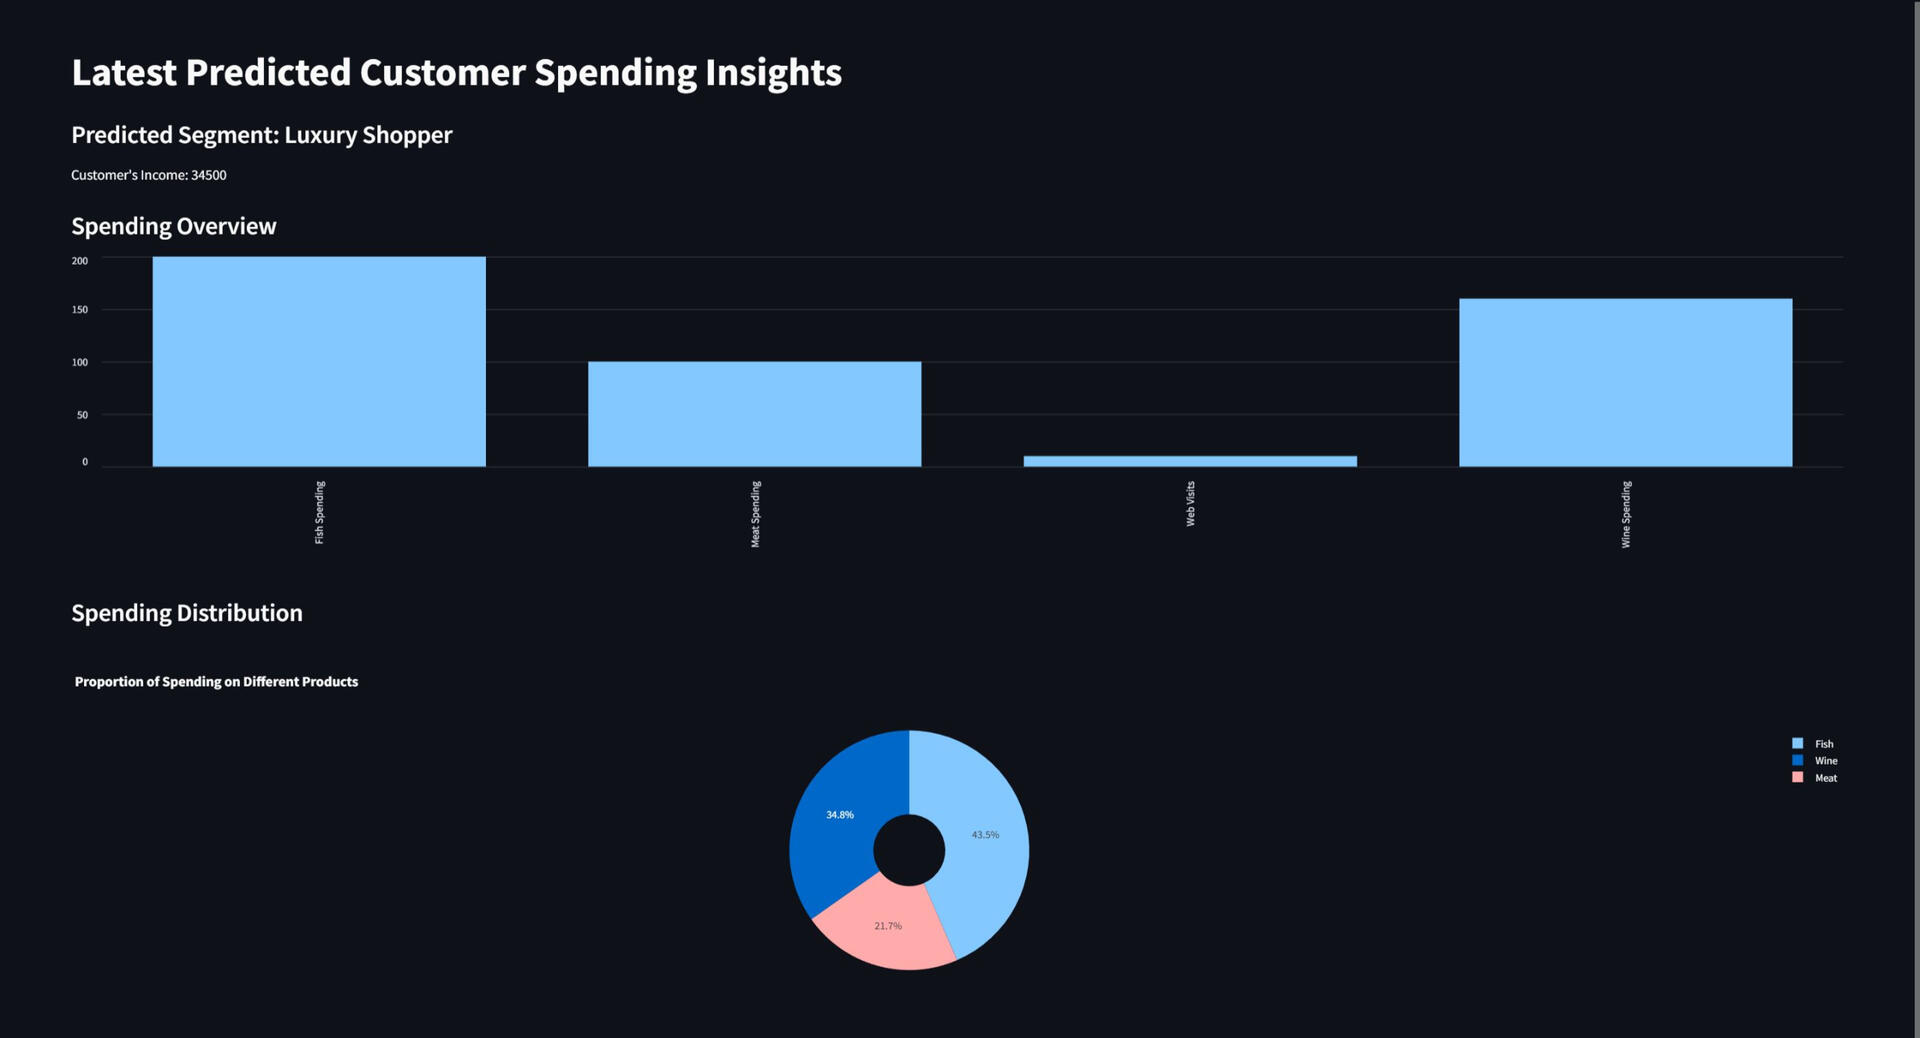
Customer Segmentation for Smarter Marketing
Customer Profiling with Targeted Marketing is a KMeans clustering project built with Python. It segments customers based on age, income, and spending habits to uncover actionable patterns. The goal is to help businesses tailor marketing strategies for different customer groups, backed by clear visuals and insights.
Client Goal:
Enhance marketing effectiveness by understanding customer segments and tailoring campaigns accordingly.
Problem:
The retail brand was treating its entire customer base uniformly, which led to poor campaign results, low engagement, and high customer churn.Solution:
Developed a customer segmentation model using KMeans clustering on purchasing behavior and demographic data. Each segment was profiled with insights to guide targeted offers, loyalty strategies, and outreach.
Impact:
The business gained clarity on who their customers really are, enabling smarter campaigns, improved conversion rates, and better customer retention.Tech Stack:
Python, Pandas, Scikit-learn, KMeans, Seaborn, Matplotlib
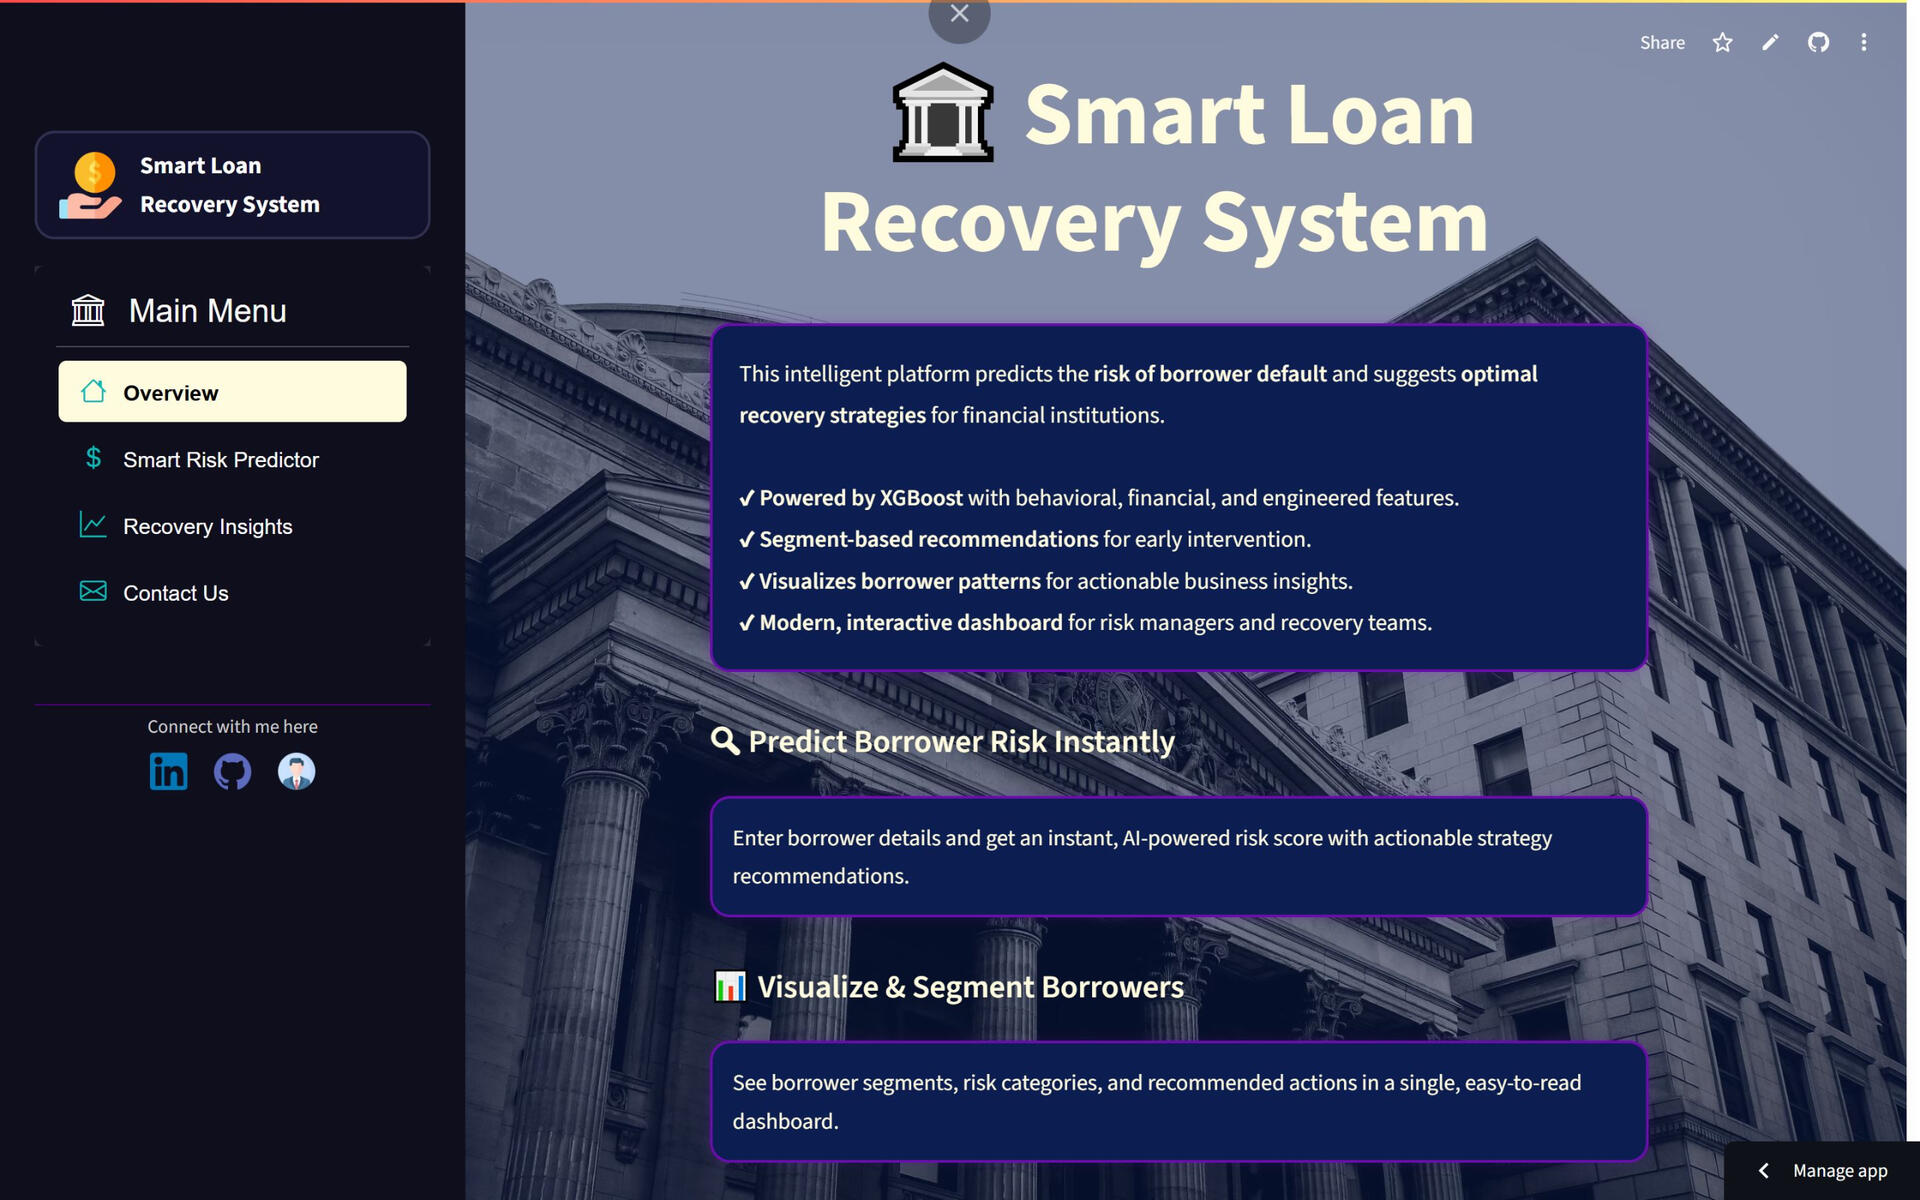
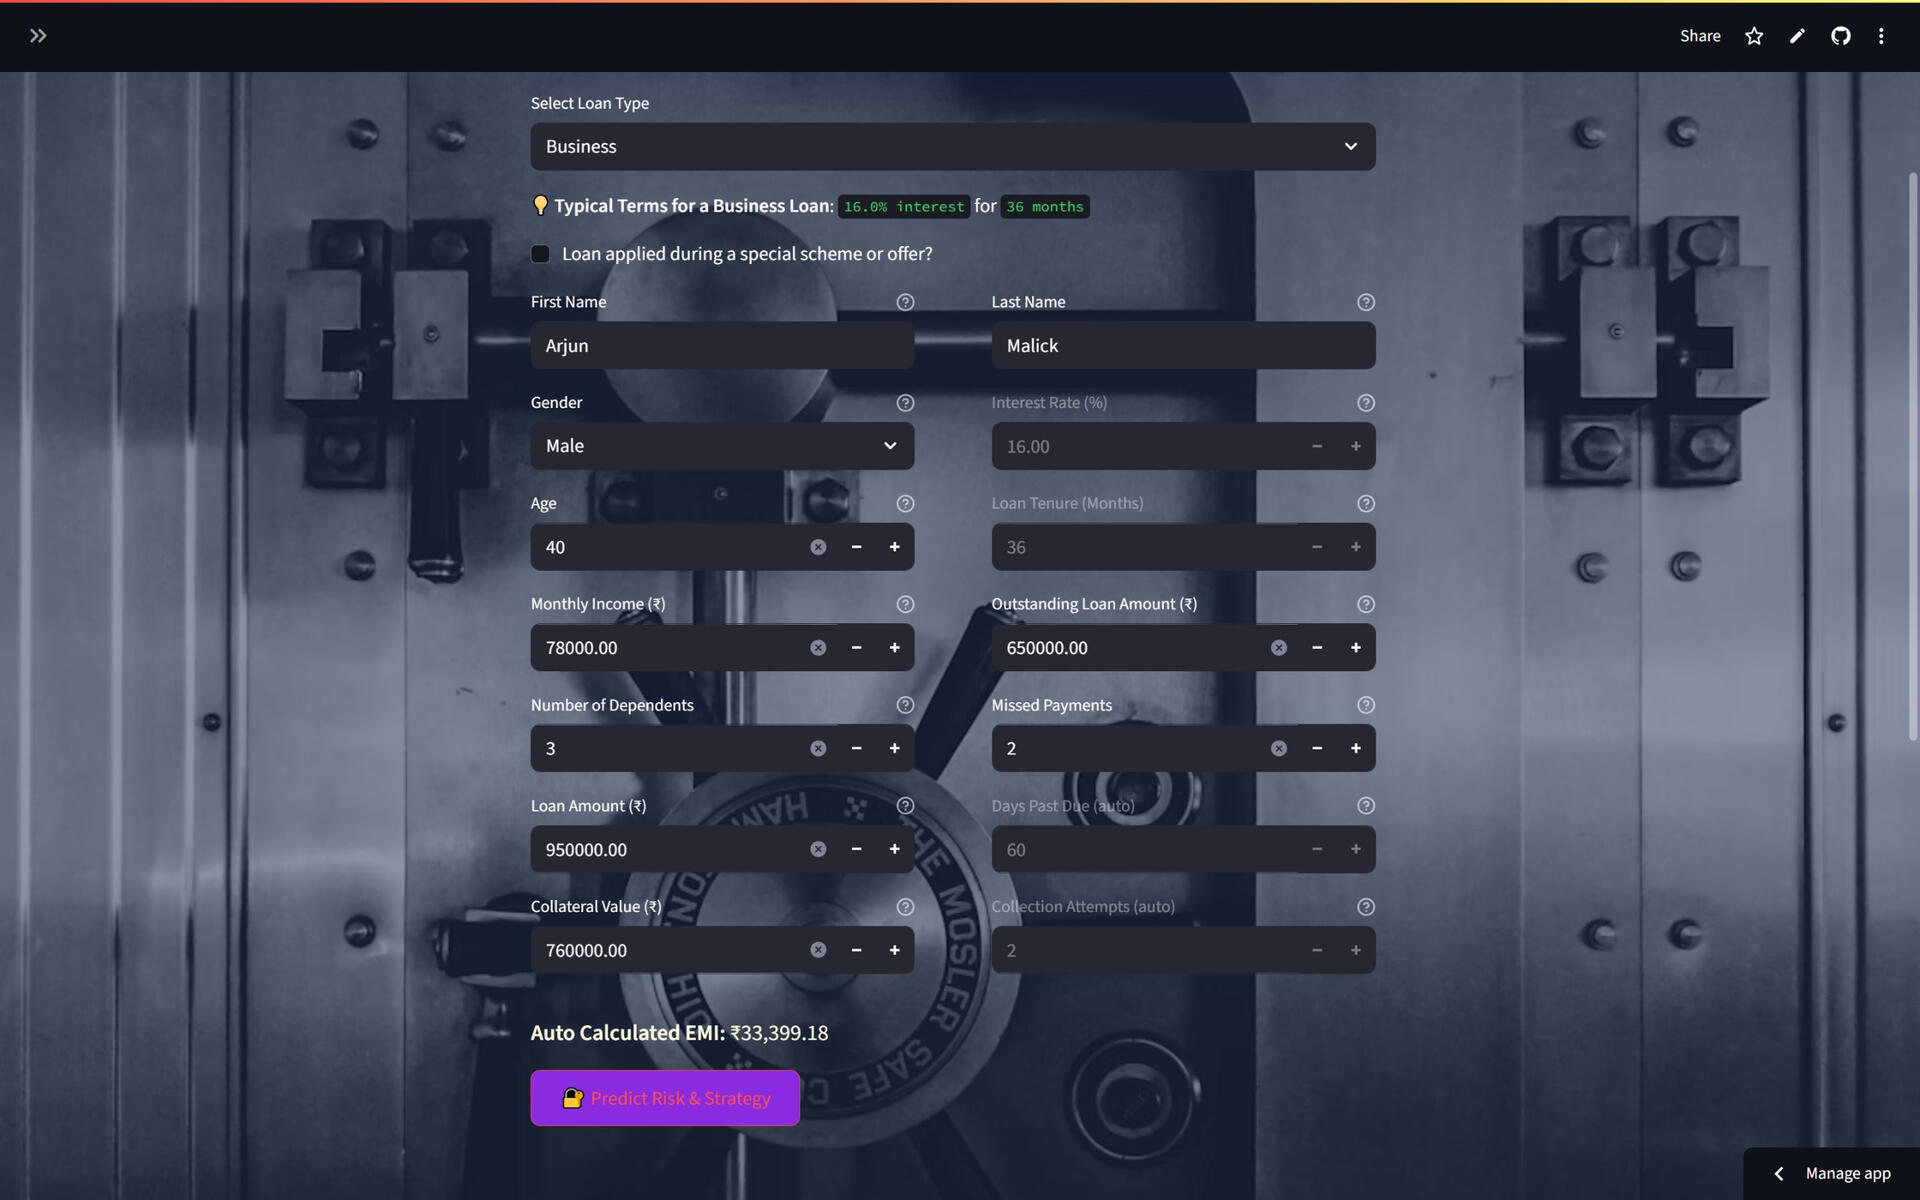
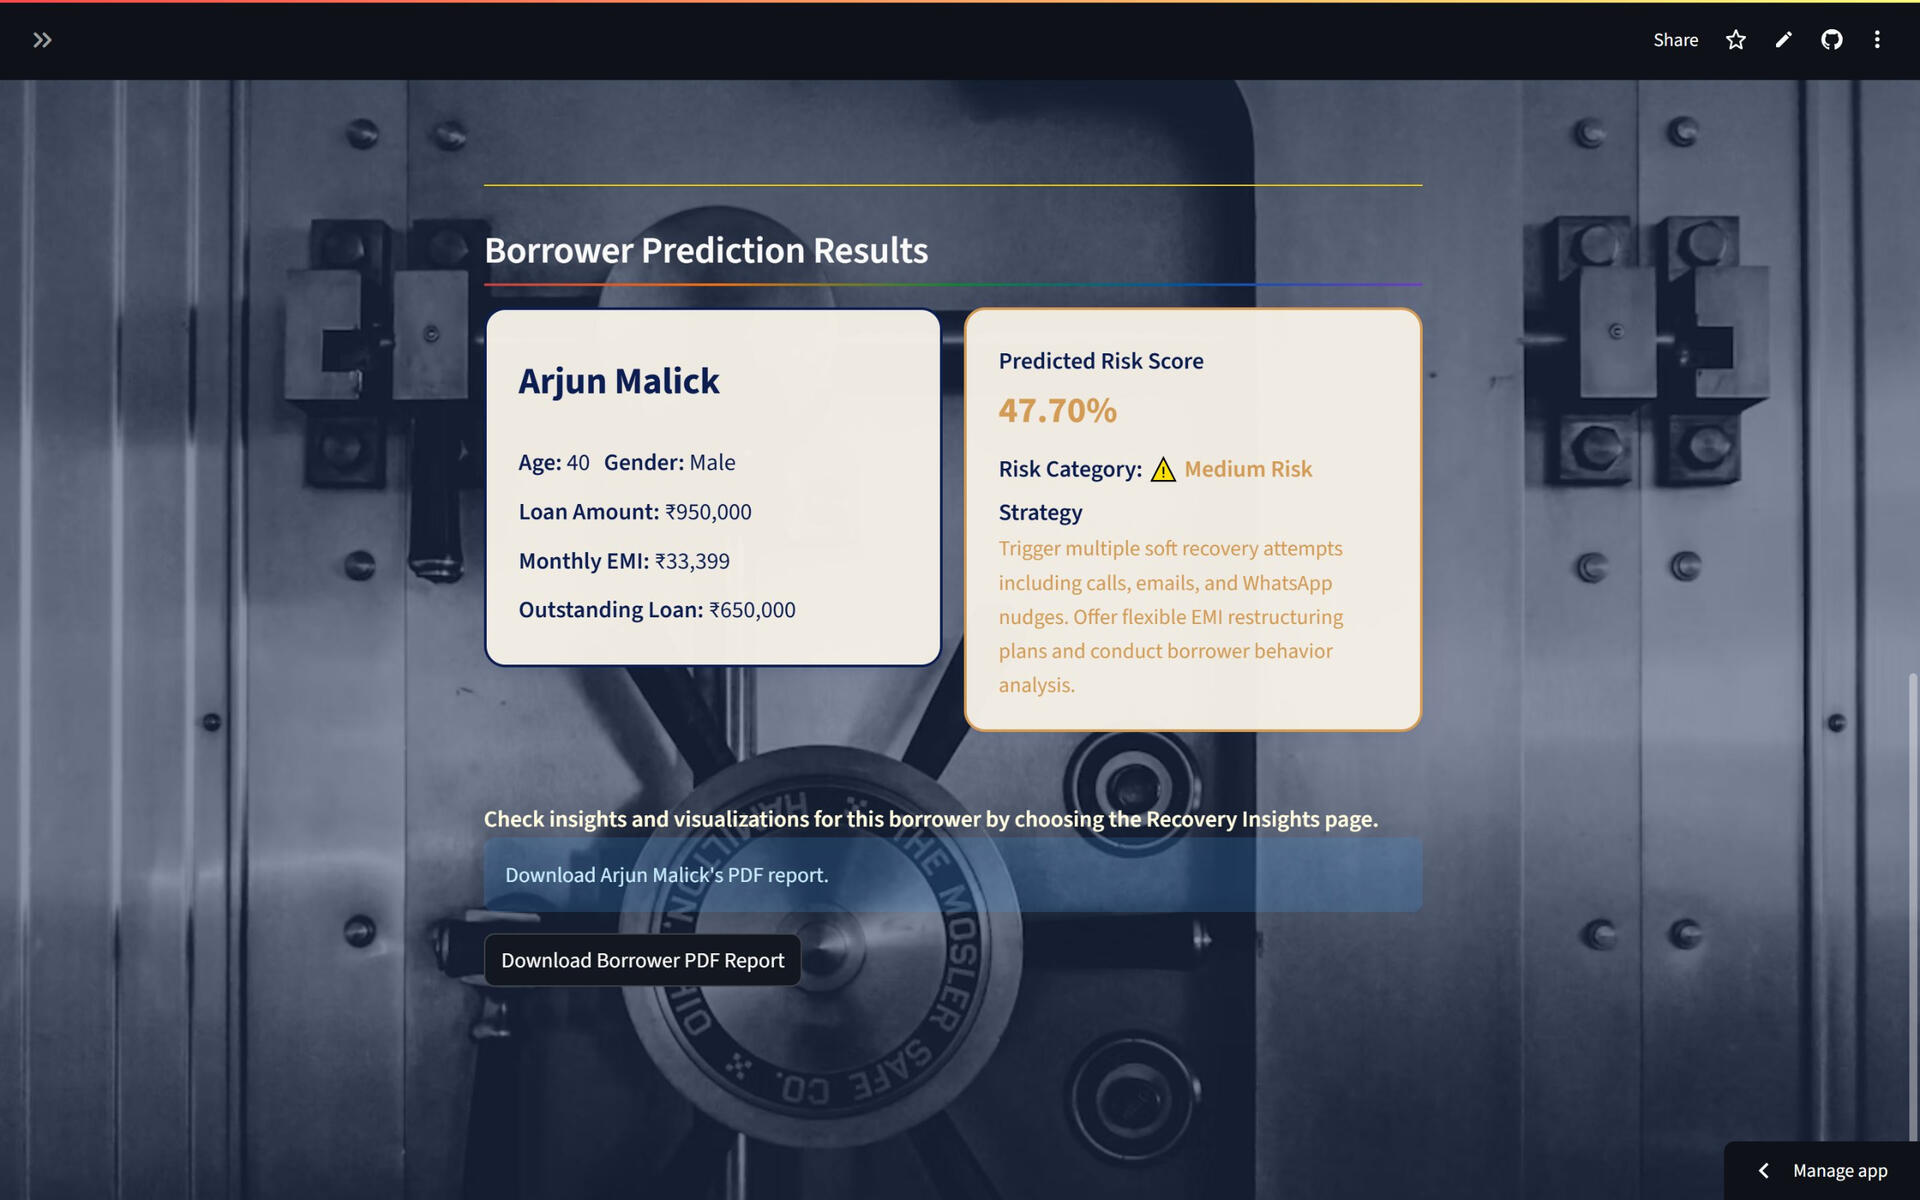
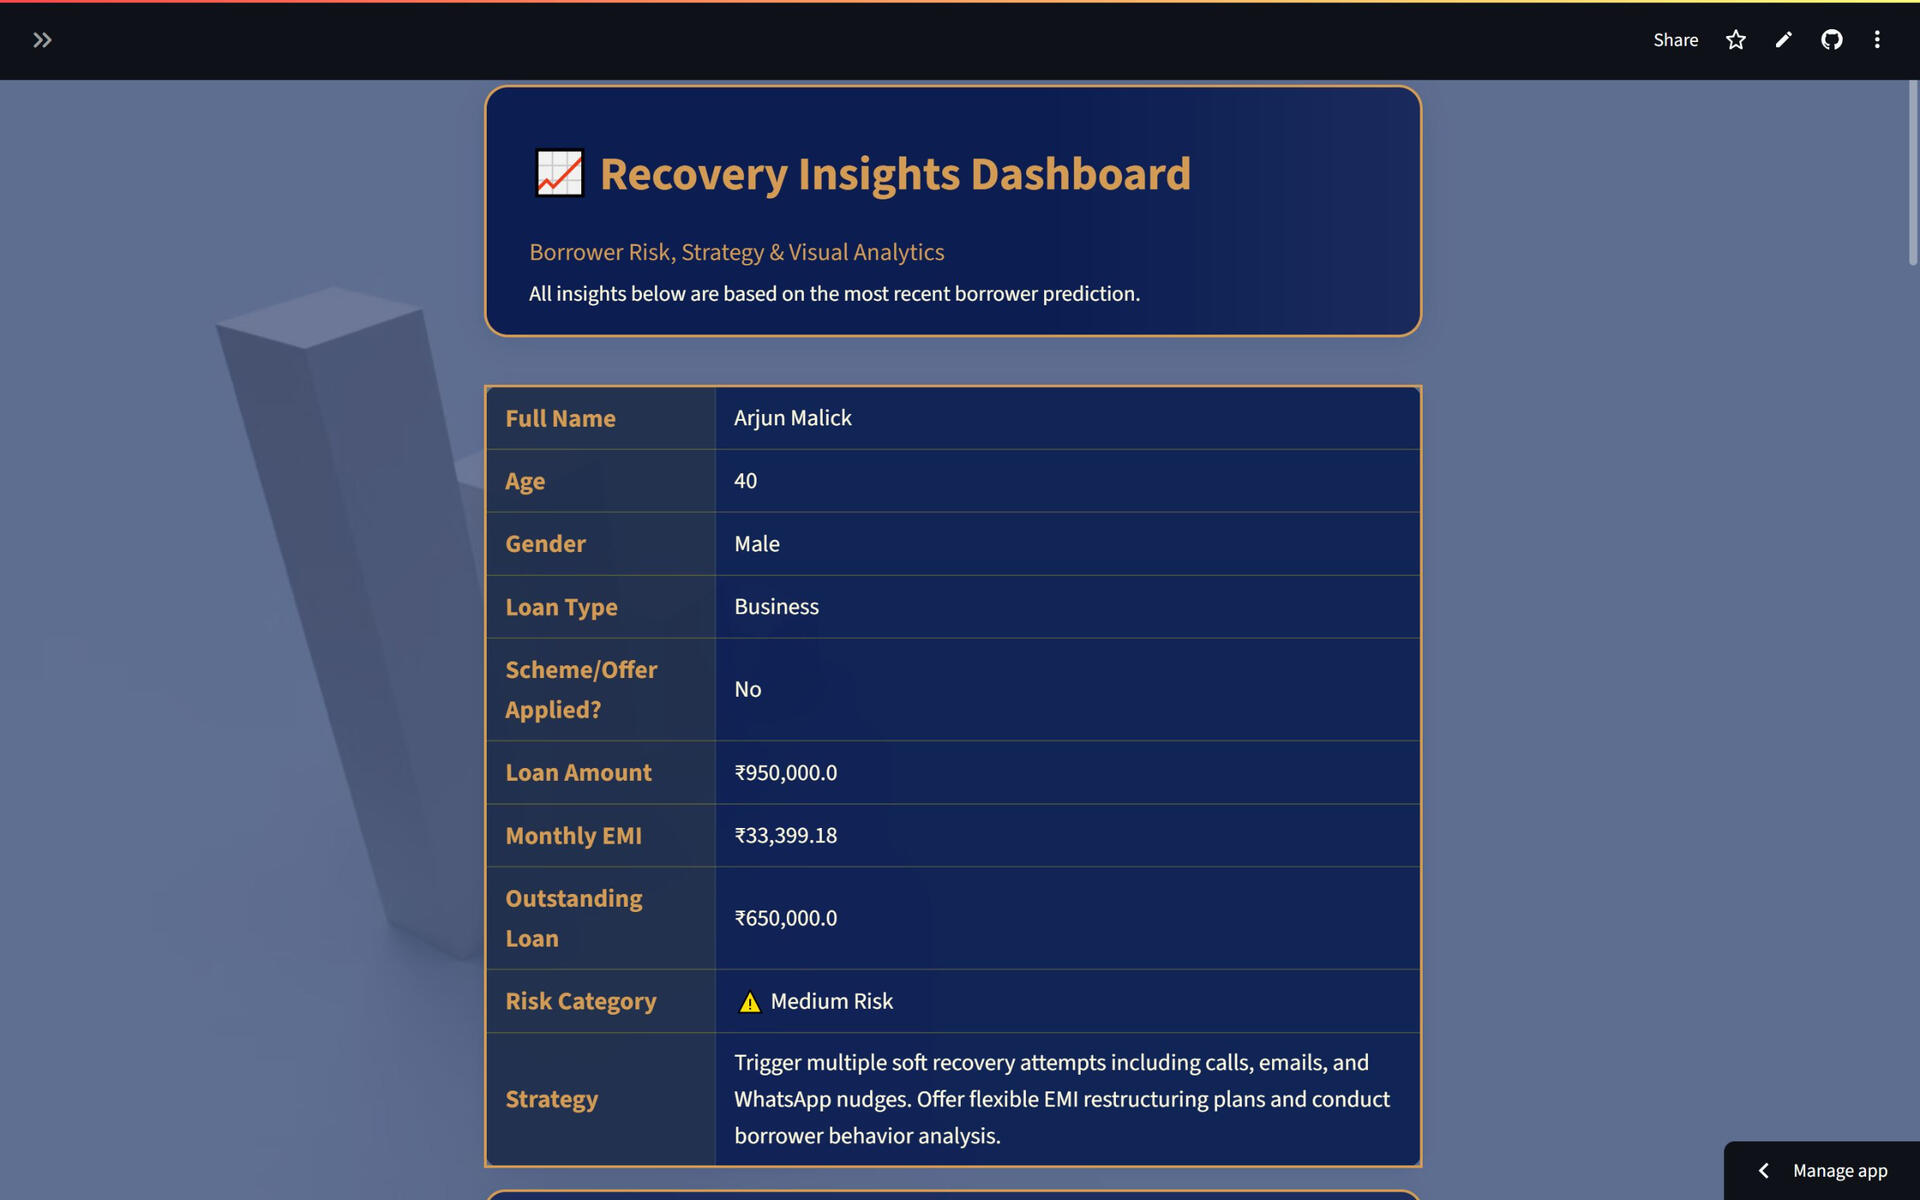
AI-Powered Loan Risk & Recovery system
The Smart Loan Recovery System is an AI-powered web app built using Python, Streamlit, XGBoost, and KMeans. It predicts borrower default risk and segments borrowers based on financial behavior. With features like SHAP explainability, automatic financial ratio calculations, and PDF reports, it helps lenders take informed, data-driven actions-all through a clean, intuitive interface.
Client Goal:
Reduce loan default risk and improve recovery rates through smarter segmentation and predictive analytics.
Problem:
The client was relying on manual heuristics to identify high-risk borrowers, resulting in delayed recovery actions and poor prioritization of outreach efforts.Solution:
Built a two-part AI system:
1. KMeans Clustering to segment borrowers based on financial behavior and risk profile.
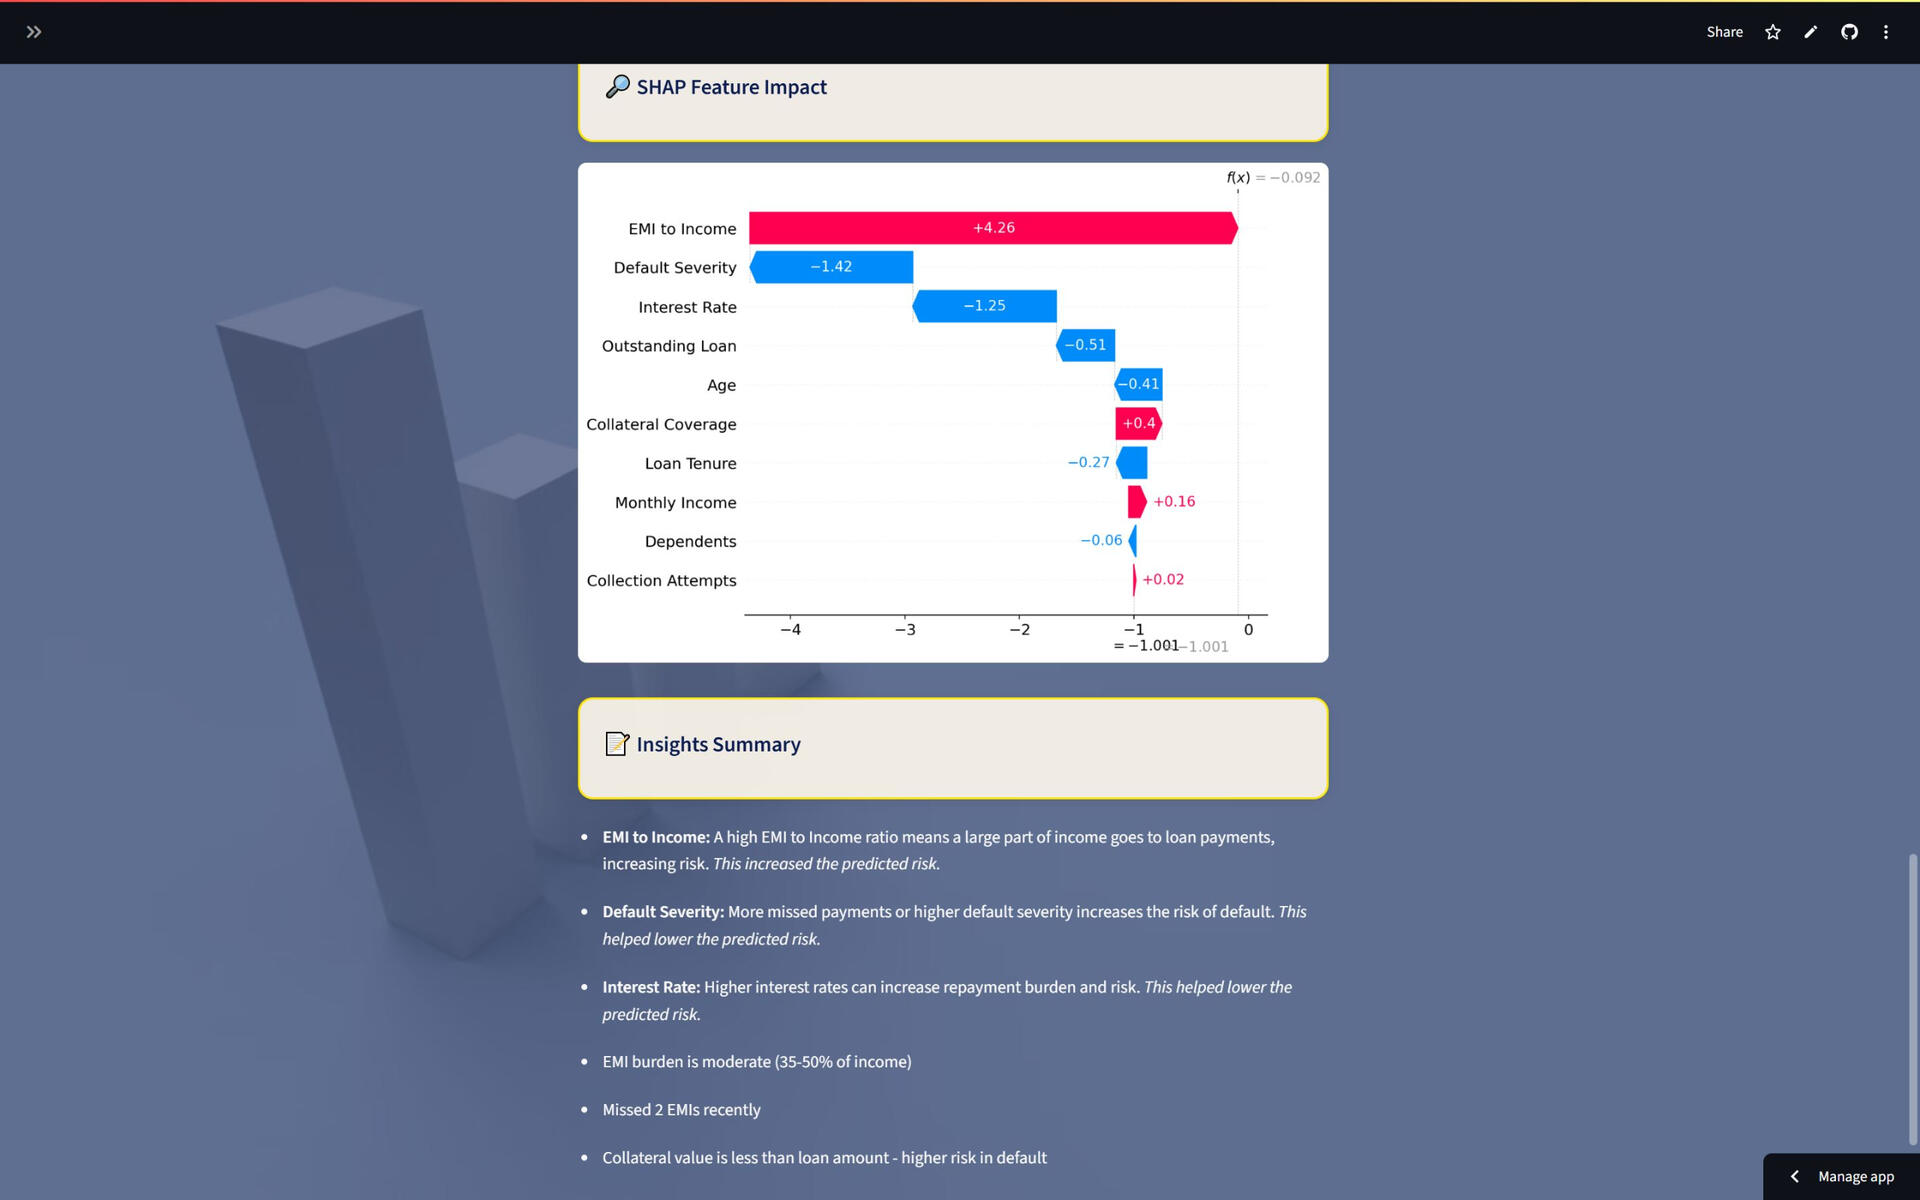
2. XGBoost Classifier to predict default probability and assign recovery strategies based on risk score.Integrated into a Streamlit dashboard with SHAP plots for transparency and visual reports for actionable decision-making. Also, an auto-generated PDF report for each borrower, summarizing their risk score, assigned segment, and tailored recovery strategy, ready to share with the collections team or stakeholders.
Impact:
Enabled the client to proactively identify risky borrowers, prioritize recovery operations, and reduce delays in repayment follow-ups — leading to better portfolio health and recovery efficiency.Tech Stack:
Python, Pandas, Scikit-learn, XGBoost, KMeans, SHAP, Streamlit, Seaborn, Matplotlib
Excel, Power BI & MySQL
Employee Retention Analysis
Performed a full-cycle retention analysis using MySQL, Excel, and Power BI to uncover attrition trends and support data-driven workforce planning.

MySQL & PowerBI
Pizza Sales Analytics Dashboard
Performed a full-stack sales analysis for a pizza restaurant using MySQL and Power BI to uncover key patterns in customer orders, revenue streams, and product performance.

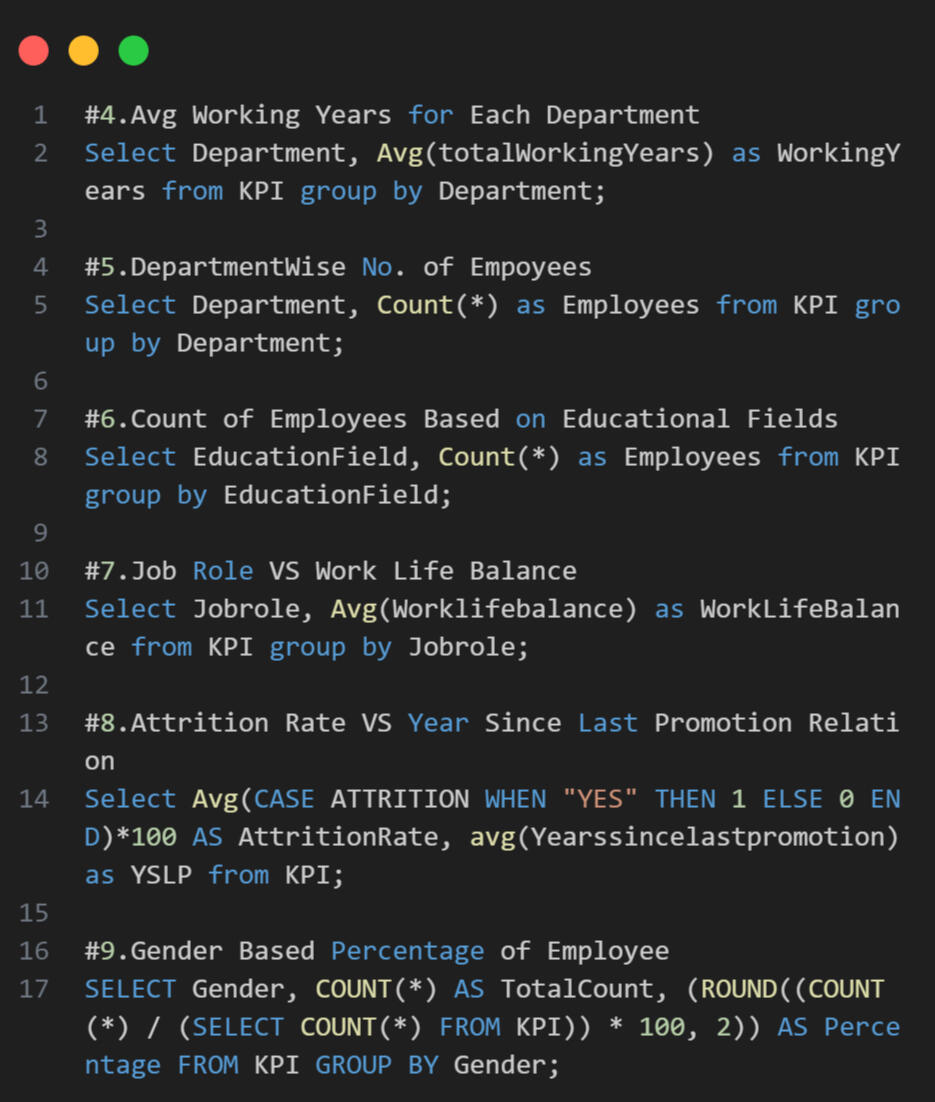
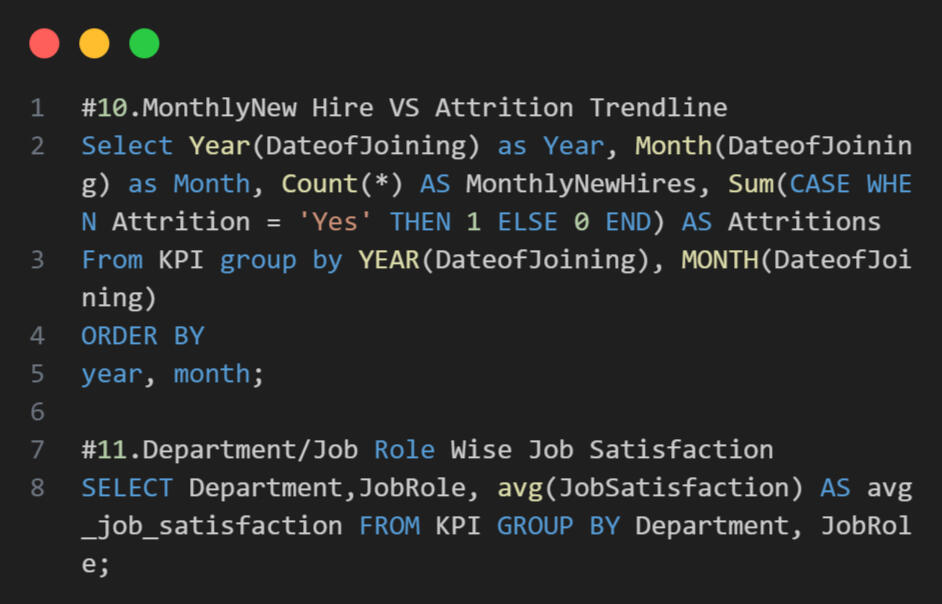
HR Analytics for Employee Retention & Workforce Insights
Client Goal:
Understand what’s driving employee turnover and use data to improve retention strategies and workforce stability.
I conducted an end-to-end HR analysis using Excel, MySQL, Power BI to identify key trends in attrition, salary, department performance, and employee satisfaction. The final dashboard deliver actionable insights for HR teams to design data-driven retention strategies.
Problem:
The company had a rising attrition rate but lacked visibility into the key drivers such as department-wise turnover, tenure-based exits, or salary inconsistencies.Solution:
Performed comprehensive analysis using:1. MySQL to extract and prepare employee data
2. Excel for data cleanup and exploratory analysis
3. Power BI to visualize trends by department, tenure, age group, and salary bracketDelivered a clear interactive dashboard with filters and summary KPIs to help HR make informed retention decisions.
Impact:
Helped the client pinpoint key attrition drivers, enabling more targeted HR interventions and better workforce planning.Tech Stack:
MySQL, Power BI, Excel
End-to-End SQL Pizza Sales Analytics Dashboard
Client Goal:
Get data-backed insights on sales performance, popular menu items, and customer ordering patterns to drive smarter menu, inventory, and staffing decisions.
Problem:
The restaurant had growing sales but no visibility into what was selling, when, and how much revenue each product brought in. They needed a clear breakdown of performance across product types, sizes, times, and categories.Solution:
Used MySQL to write modular queries across multiple relational tables (orders, pizzas, order details) to extract insights such as:1. Total orders and total revenue
2. Top 5 most-ordered pizza types
3. Most popular pizza sizes and categories
4. Hourly order distribution and daily ordering trends
5. Top revenue-generating pizzas by category
6. Cumulative revenue and % contribution by pizza type
All insights were compiled into an interactive Power BI dashboard, allowing the client to filter by date, size, and category for on-the-fly decision-making.


